

Hodges U is a top rated school for veterans 3 years in a row. See why here!

Use our program selecting tool to start your #MyHodgesStory today.

See how easy our admission process is
The annual retention rate is defined as the percentage of undergraduate, degree-seeking students enrolled in a fall term who are still enrolled in the following fall term. Annual retention rates are calculated for a number of different cohorts, of which the all enrolled bachelor’s cohort is the largest; and thus, the most representative of Hodges’ student body. Our target for the annual retention rates for the all enrolled bachelor's degree-seeking students is set to 72% with a threshold of acceptability at 58%.
| All Enrolled Students Cohort | FALL 2012 – 2013 | FALL 2013 – 2014 | FALL 2014 – 2015 | FALL 2015 – 2016 | FALL 2016 – 2017 | FALL 2017 – 2018 | FALL 2018 – 2019 | FALL 2019 – 2020 | FALL 2020 – 2021 |
| Bachelor's | 65% | 63% | 65% | 69% | 61% | 63% | 68% | 63% | 63% |

Students often report that their first term in college is the most difficult, especially for those who are returning to school after an extended absence, who work full-time, and who are supporting families. Hodges University reaches out to students with services designed to help them be successful – especially during that critical first term.
The term persistence rate is defined as the percentage of degree-seeking students enrolled in a fall term who are still enrolled in the following winter term. Term persistence rates are calculated for a number of different cohorts, of which the all enrolled degree-seeking students are the most representative of Hodges’ student body. In addition, the veterans’ cohort which aligns with Hodges’ commitment as a Military Friendly School, is measured to ensure a high level of support to our service men and women.
The term-to-term persistence rates for the all enrolled degree-seeking students and veterans cohorts confirm that a large majority of students succeed in their first term and re-enroll at Hodges University for their second term in college. Based on the trend data from fall 2012 to fall 2020, the achievement goal for the two cohorts was set to 88% and the threshold of acceptability at 61%.
| ALL ENROLLED STUDENTS COHORT | FALL 2012 – 2013 | FALL 2013 – 2014 | FALL 2014 – 2015 | FALL 2015 – 2016 | FALL 2016 – 2017 | FALL 2017 – 2018 | FALL 2018 – 2019 | FALL 2019 – 2020 | FALL 2020 – 2021 |
| Degree-Seeking Students | 75% | 77% | 76% | 78% | 75% | 76% | 76% | 65% | 76% |
| Veteran Students | 73% | 78% | 72% | 83% | 78% | 79% | 84% | 72% | 84% |
Hodges University strives continuously to align its programs to marketable careers and job opportunities for our graduates, as evidenced by mapping our programs to occupational jobs listed on O*NET Online and BLS websites. As part of our effort to assess the employment rates and earnings of our graduates, Hodges uses the data collected by the Florida Education and Training Placement Information Program (FETPIP), which collects data from all Independent Colleges and Universities of Florida (ICUF) institutions. In the most recent published data, Hodges University ranks very high in comparison with its ICUF peers, with Hodges students consistently ranking in the top five for average annual earnings for baccalaureate graduates employed between 2011 and 2019.
| YEAR | NUMBER OF BACHELOR GRADUATES | NUMBER EMPLOYED | PERCENT OF BACHELOR GRADUATES EMPLOYED | AVERAGE ANNUAL EARNINGS FOR BACHELOR GRADUATES | HU’S RANK AMONG ICUF PEERS |
| 2011 | 329 | 244 | 74% | $37,940 | 1 |
| 2012 | 295 | 214 | 73% | $39,092 | 1 |
| 2013 | 274 | 205 | 75% | $36,166 | 1 |
| 2014 | 288 | 198 | 69% | $38,334 | 4 |
| 2015 | 257 | 202 | 79% | $43,179 | 1 |
| 2016 | 208 | 142 | 68% | $41,691 | 4 |
| 2017 | 220 | 170 | 77% | $47,092 | 2 |
| 2018 | 177 | 123 | 70% | $47,176 | 4 |
| 2019 | 162 | 112 | 69% | $51,300 | 4 |
Based on the 9-year FETPIP job placement trend data for the percentage of bachelor graduates employed, Hodges University set its achievement goal to 83% and its minimal threshold of acceptability at 64%.
To help students reach their career goals, the Student Experience department provides career advice, services, tools and resources, which assist the graduates in their job search and prepare them for employment opportunities.
Hodges University has provided a state-of-the-art health facility for its health and medical science programs. The programs which utilize these facilities are monitored annually by their program accreditors to assess the level of student success. The following tables show the licensure exam pass rate and graduate employment rate for the past three reporting periods for the students in the Bachelor of Science in Nursing (BS.NUR) and the Associate in Science in Physical Therapist Assistant (AS.PTA) programs. Even with the disruption of the Covid-19 “Stay at Home” orders and the decrease in patient loads when elective surgeries were temporarily eliminated, the licensure exam pass rates for all cohorts were within the expected level of acceptability of 95% for BS.NUR and 85% for AS.PTA, as reported to their respective program accreditors.
| Academic Program | BS Nursing | AS Physical Therapist Assistant | ||
| Licensure Exam Year/Pass Rate | 2019 | 100% | 2019 | 92.9% |
| 2020 | 80% | 2020 | 86.7% | |
| 2021* | 66% | 2021** | 90% | |
* The pass rates are not reflective of the number of graduates; once the remaining students take the NCLEX, this number will be revised.
** The rest of the 2021 AS.PTA graduating class will take the NPTE in April 2022 as they just graduated in December 2021.
In addition to licensure exam pass rates, the graduate employment rates for these cohorts are closely monitored to ensure that Hodges continues to “leverage higher learning” in preparing students for the most sought after career fields in the surrounding communities.
Likewise, the employment rates for all graduate cohorts were within the expected level of acceptability of 100% for BS.NUR and 90% for AS.PTA.
| Academic Program | BS Nursing | AS Physical Therapist Assistant | ||
| Licensure Exam Year/Pass Rate | 2019 | 100% | 2018 | 100% |
| 2020 | 100% | 2019 | 100% | |
| 2021* | 66% | 2020 | 100% | |
* All students who pass the NCLEX are hired immediately into the clinical setting. Once the scores for the remaining students are received, this number will be revised.
With the increased building space and specialized equipment, the AS.PTA program has expanded to two cohorts, one starting in January and the other in July, each with 25 students.
While in their program of study, the students engage in instruction at off-site clinical/healthcare locations. This prepares the student for their future clinical work, as well as introduces them to potential hiring opportunities.
One of the most commonly accepted measures of performance among postsecondary institutions is graduation rates. The IPEDS overall graduation rate at 150% is based on the percentage of full-time, first-time (true freshmen) undergraduate degree-seeking students who graduate within 150% of the normal time for program completion. Although this measure is intended to be used for peer comparison, it has some limitations. The most significant one is that when the size of this cohort is a very small percentage of an institution's total enrollment, then the achievement of this small group does not adequately represent the institution as a whole. For Hodges University, the full-time, first-time, undergraduate degree-seeking students represent on average 7% of the total enrolled undergraduate students.
The IPEDS true freshmen cohort tends to be comprised of younger students who have recently graduated from high school; whereas, the students at Hodges University are older working adults with families who have transferred to Hodges from other institutions. Therefore, to reflect the greater student population at Hodges University, the IPEDS fall census data is used to compute internal graduation rates at 150% of the normal time for program completion for all transfer-in, undergraduate degree-seeking students.
Based on the 8-year trend data for the fall 2007 to fall 2014 cohorts, Hodges University set its achievement goal for internal graduation rates at 150% for the transfer-in, undergraduate degree-seeking student cohort to 60% and its minimal threshold of acceptability at 26%.
| Undergraduate Degree-Seeking Students | Fall 2007 | Fall 2008 | Fall 2009 | Fall 2010 | Fall 2011 | Fall 2012 | Fall 2013 | Fall 2014 |
| Transfer-in Cohort | 51% | 54% | 36% | 35% | 35% | 38% | 33% | 42% |
To better represent Hodges University, the new IPEDS outcome measure was recently selected as our SACSCOC key completion indicator. Although this measure has only been collected for a few years, the baseline trend analysis corroborates that this outcome, with the inclusion of the transfer-in students, more accurately captures working adults returning to school. Based on the 7-year trend data for the 2007 to 2013 cohorts, Hodges University set its achievement goal for the 8-year outcome measure of the non-first-time, full-time undergraduate degree-seeking cohort to 67% and its minimal threshold of acceptability at 30%.
| Undergraduate Degree-Seeking Students | 2007 Cohort | 2008 Cohort | 2009 Cohort | 2010 Cohort | 2011 Cohort | 2012 Cohort | 2013 Cohort |
| Full-time, Non-First-time Entering | 56% | 59% | 44% | 42% | 42% | 38% | 40% |
The NSC Research Executive Summary on Transfer and Mobility states that “increasingly more students attend multiple institutions, transferring once, twice or even three times before earning a degree.” It also notes how “the results suggest that the linear view of college access and success that focuses on the initial institution attended often fails to address the realities on the ground.”
Thus, to better inform and track student mobility for an institution, the NSC StudentTracker® report provides the total 6-year completion data of an institution’s starting cohort. By providing the counts of those who completed their degree in house along with the counts of those who completed their degree based on the initial contribution provided by the institution, these data show the effect an institution has on assisting their starting cohort in obtaining their degree.
| Fall 2010 | Fall 2011 | Fall 2012 | Fall 2013 | Fall 2014 | Fall 2015 | |
| Total students in cohort | 634 | 495 | 517 | 454 | 393 | 277 |
| Total students retained at end of first year | 566 | 411 | 440 | 384 | 341 | 255 |
| Totals students who received award at end of six years | 274 | 220 | 225 | 183 | 163 | 115 |
| Six Year Completion Rate | 43.2% | 44.4% | 43.5% | 40.3% | 41.5% | 41.5% |
| Average Six-year Completion Rate | 42.41% | |||||
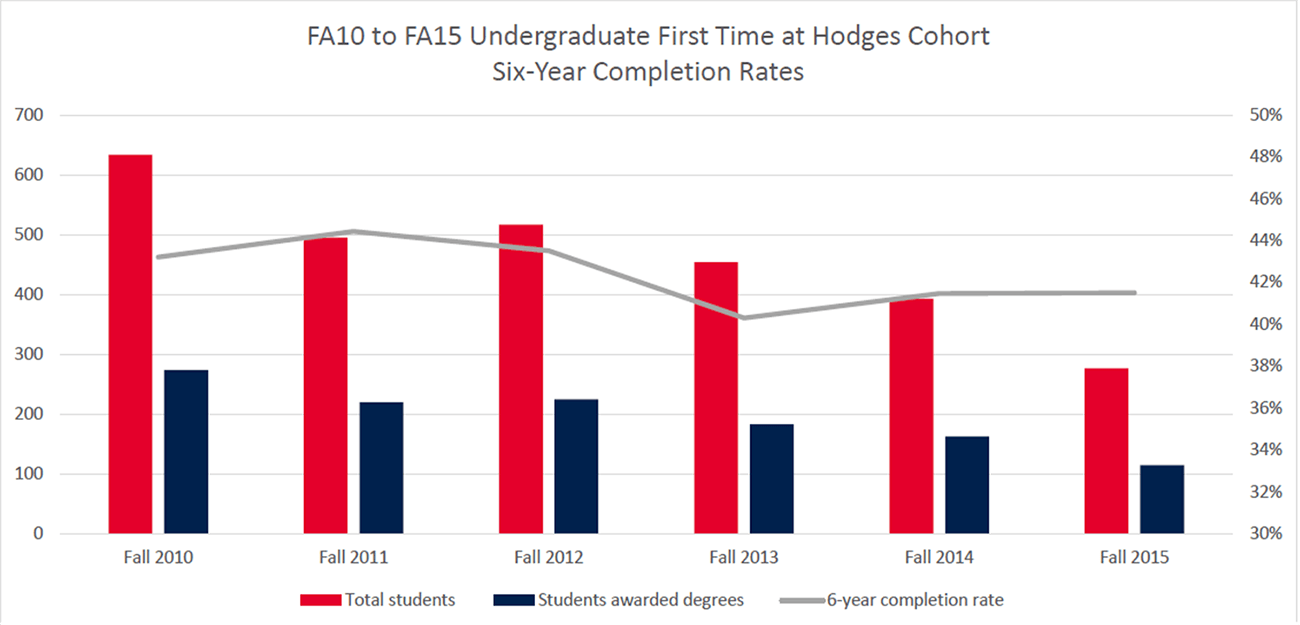
Hodges’ mission to “prepare students to leverage higher education” encompasses those who complete their degree in house and those who continue to pursue their degree at another institution. Following the fall 2010 to fall 2015 cohorts with NSC StudentTracker, the average six-year graduation rate is 42.4%. This closely matches Hodges’ average internal graduation rate at 150%; and therefore the achievement goal for our NSC total 6-year completion rate is also set to 60% and the threshold of acceptability at 26%.
We use cookies and other data collection tools to create the best possible user experience, to better understand how they are used please visit our privacy policy page. By continuing to use this site you are giving us your consent to do this.To the extent the General Data Protection Regulation (“GDPR”) is applicable to me, by visiting this website I hereby consent to the processing of my Personal Data as defined by the GDPR for the purposes outlined and provided for in Hodges’ policies, as amended from time to time. I understand that in certain circumstances, I have the right to object to the processing of my Personal Data. I further understand that I have the right to request (1) access to my Personal Data; (2) rectification of mistakes or errors and/or erasure of my Personal Data; (3) that Hodges restrict processing of my Personal Data; and (4) that Hodges provide my Personal Data upon request in a portable format
© Copyright Hodges University 2018-2021 | Privacy Policy | Consumer Information | Hodges University is regionally accredited by the Southern Association of Colleges and Schools Commission on Colleges to award associate, bachelor’s, and master’s degrees. Questions about the accreditation of Hodges University may be directed in writing to the Southern Association of Colleges and Schools Commission on Colleges at 1866 Southern Lane, Decatur, GA 30033-4097, by calling (404) 679-4500, or by using information available on SACSCOC’s website. All other inquiries regarding Hodges University’s educational programs, admissions requirements, financial aid, etc., should be directed to Hodges University and not to the Southern Association of Colleges and Schools Commission on Colleges. The curriculum of each clinical program at Hodges University meets the professional licensure requirements of the state of Florida. These clinical programs include the Master of Science in Clinical Mental Health Counseling, Bachelor of Science in Nursing, Bachelor of Science in Dental Hygiene, Associate of Science in Physical Therapist Assistant, Certificate in Emergency Medical Technician, Certificate in Paramedics, and Certificate in Practical Nursing. Hodges University has not made a determination whether the programs, listed above, meet the professional licensure requirements of other states. Students who plan to relocate outside of Florida must confirm that the curriculum meets that state’s requirements.